CFD Analysis of Aerodynamic Components for Freightliners

Introduction:
•Aerodynamics simulation in the automotive industry is a big research area currently due to its ability to provide large gains in aerodynamic efficiency. Any reduction in aerodynamic drag directly correlates to increases in fuel economy. With both government regulation and consumers focusing on these efficiency numbers, it’s essential to maximize aerodynamic efficiency in any way possible.
•The graphic shows the key aerodynamic areas of a tractor trailer. The rear fairing that attaches to the back of the truck is advertised to bring a 5% benefit to fuel economy alone, so it’s clear that there is a large amount of improvement that can be made with these designs.
•The ultimate goal of the project was to simulate the drag experienced by a standard cargo truck and one that has specific aerodynamic devices. This comparison will give us accurate numbers on aerodynamic drag efficiency and illustrate whether or not these product warrant the financial investment.


The red model above shows the default Mercedes Atego truck that was used for testing. The blue model is the same truck with the additional aerodynamic devices installed. These devices are the front cabin fairing, side skirts, and rear cargo fairing.
Setup:
The simulation was setup in Creo Parametric by using an assembly in order to isolate each component and it’s specific impact on the overall drag and efficiency calculations. The domain was setup with the ground at the height of the truck tires and the front as the air inlet. The top, sides, and back were setup as atmospheric pressure.

Results:
The video above shows some very interesting characteristics of the flow dynamics around the vehicle both before and after the aerodynamic components are installed. The most obvious one is the amount of turbulence and low energy flow behind the unmodified design. This is clearly a very inefficient area and shows that there is lots of improvements that can be made overall. The modified design maintains its air velocity along the profile of the vehicle and exists in much more fast and efficient method.


The simulation above shows the velocity magnitude of the airflow along the side profile of the truck. The modified design has much higher energy airflow along the top and rear of cargo container.
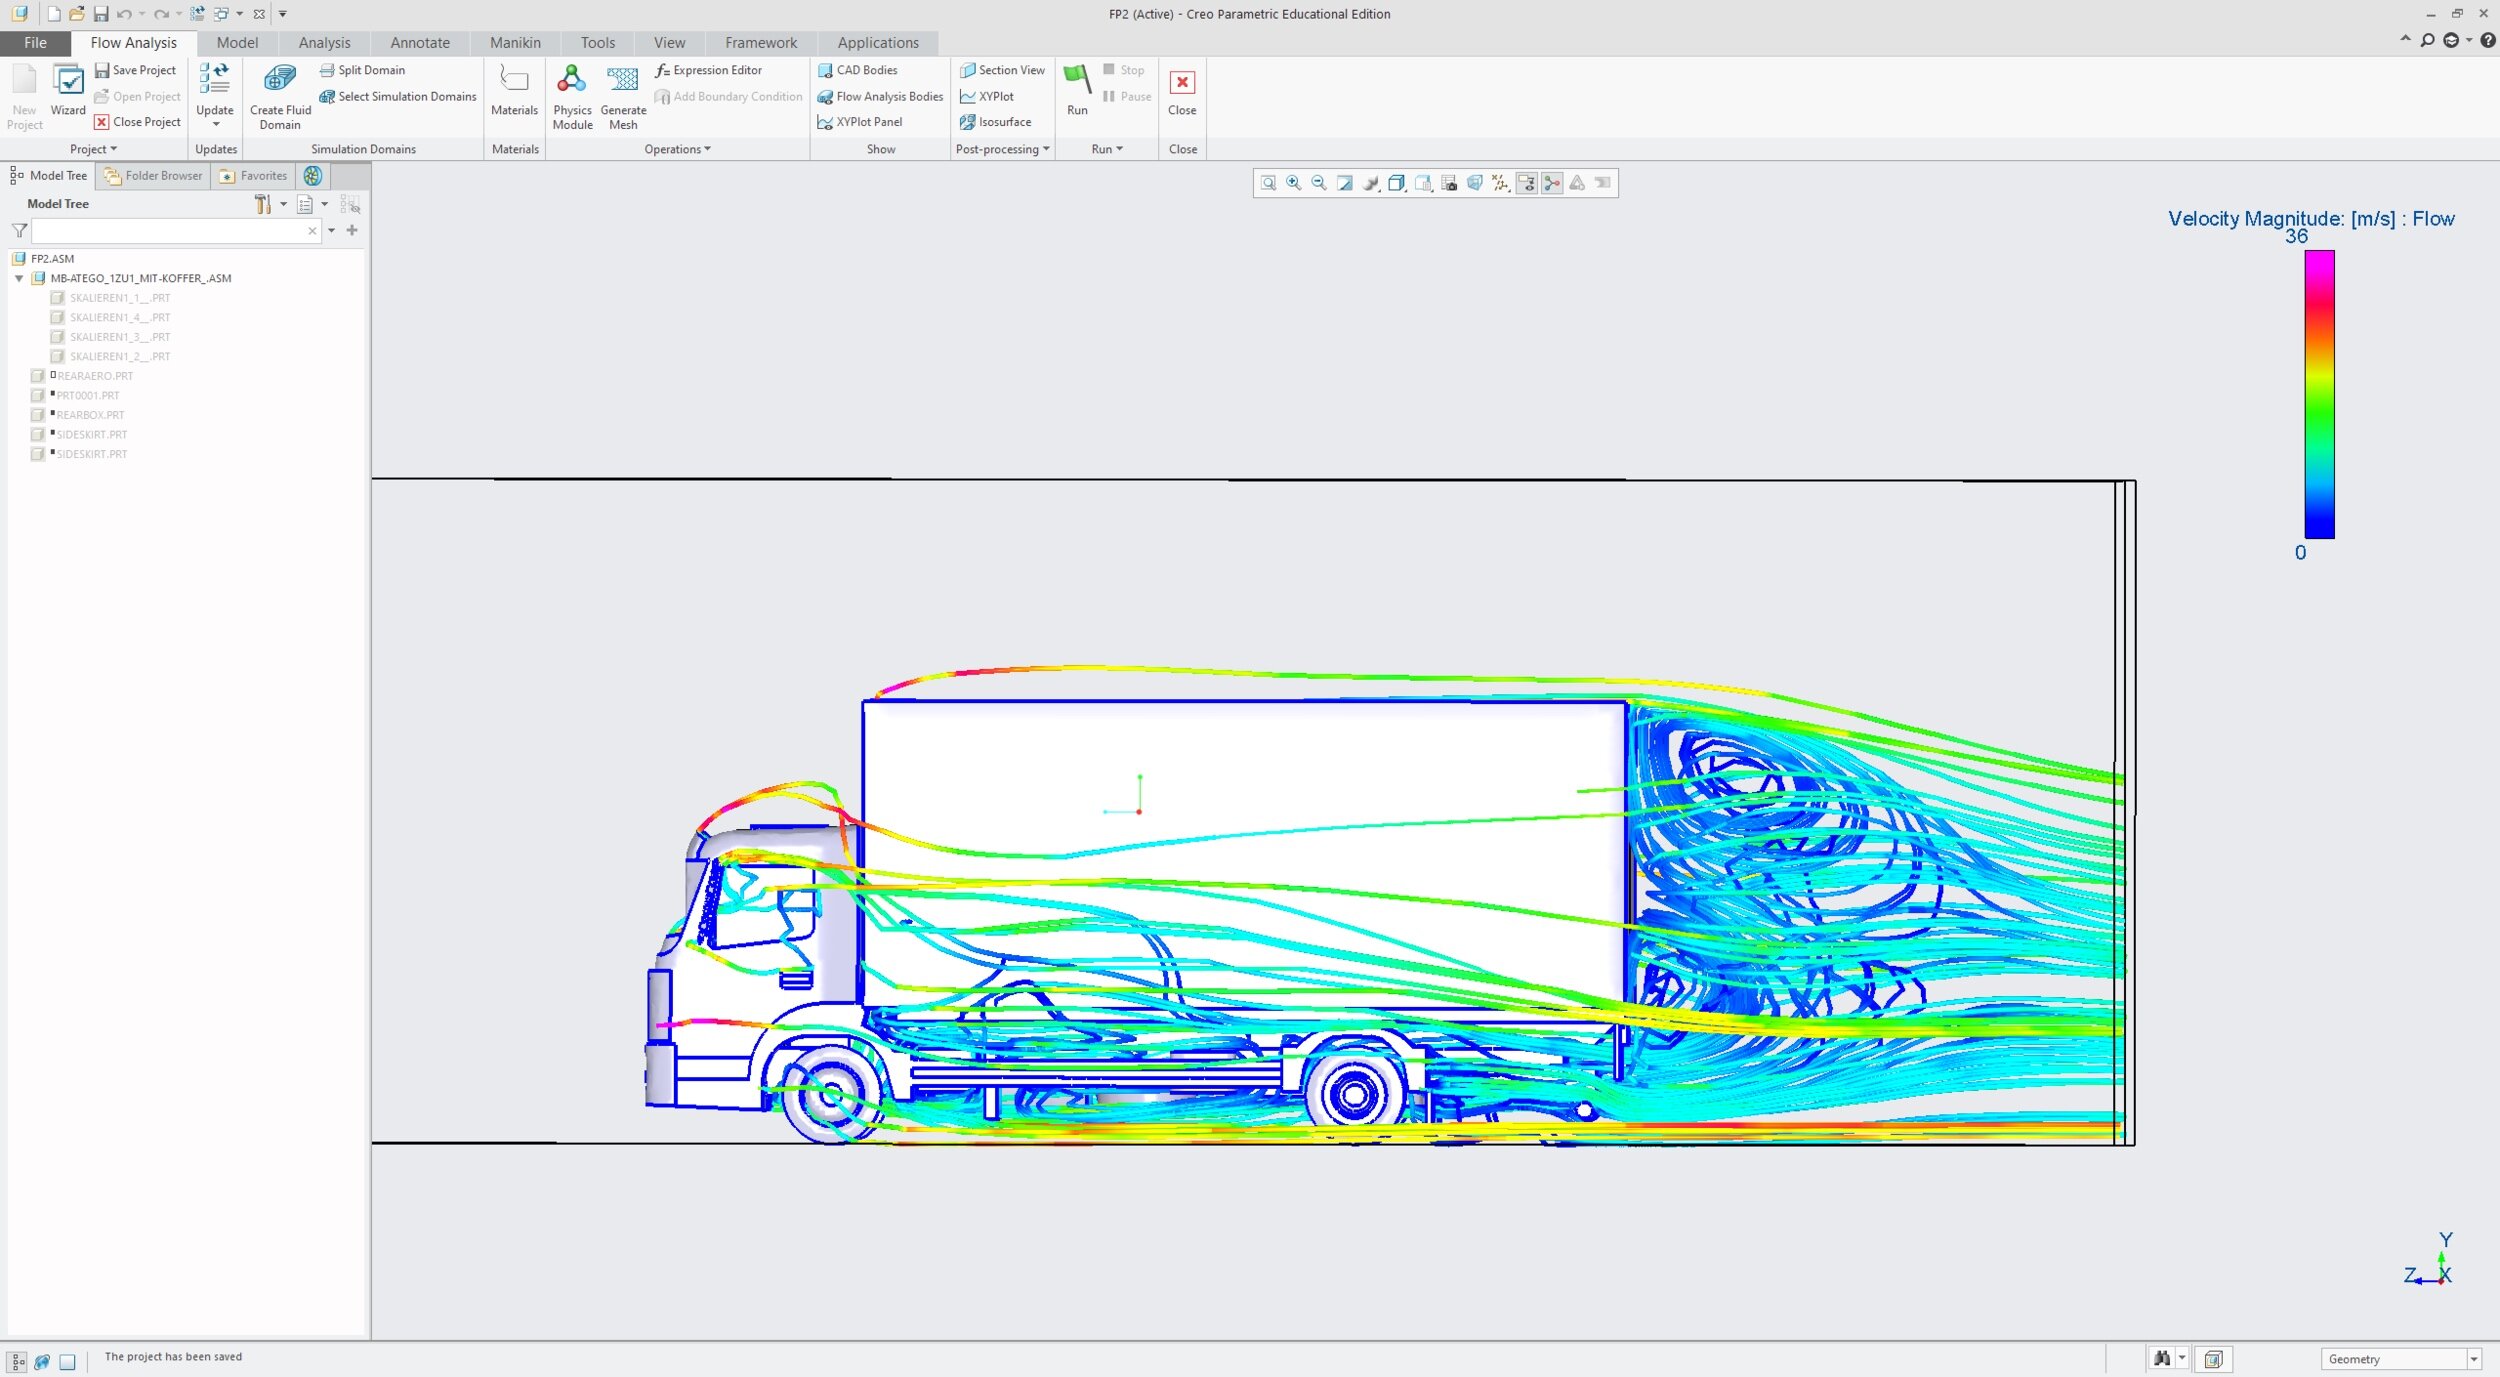

This simulation shows the flow lines of air with the color corresponding to the velocity magnitude. These plots do a good job of showing the actual travel of the airflow and allow us to visualize the flow in an intuitive way. The unmodified design has strong turbulence behind the vehicle that creates larges amounts of slow air that creates a low pressure area that decreases the efficiency of the vehicle. The modified design has much cleaner exit lines at higher velocities. This shows the true efficiency gains in a visual way.