Fright-Liner CFD Simulation
Introduction
Aerodynamics simulation in the automotive industry is a big research area currently due to its ability to provide large gains in aerodynamic efficiency. Any reduction in aerodynamic drag directly correlates to increases in fuel economy. With both government regulation and consumers focusing on these efficiency numbers, it’s essential to maximize aerodynamic efficiency in any way possible.
The ultimate goal of the project was to simulate the drag experienced by a standard cargo truck and one that has specific aerodynamic devices. This comparison will give us accurate numbers on aerodynamic drag efficiency and illustrate whether or not these product warrant the financial investment.
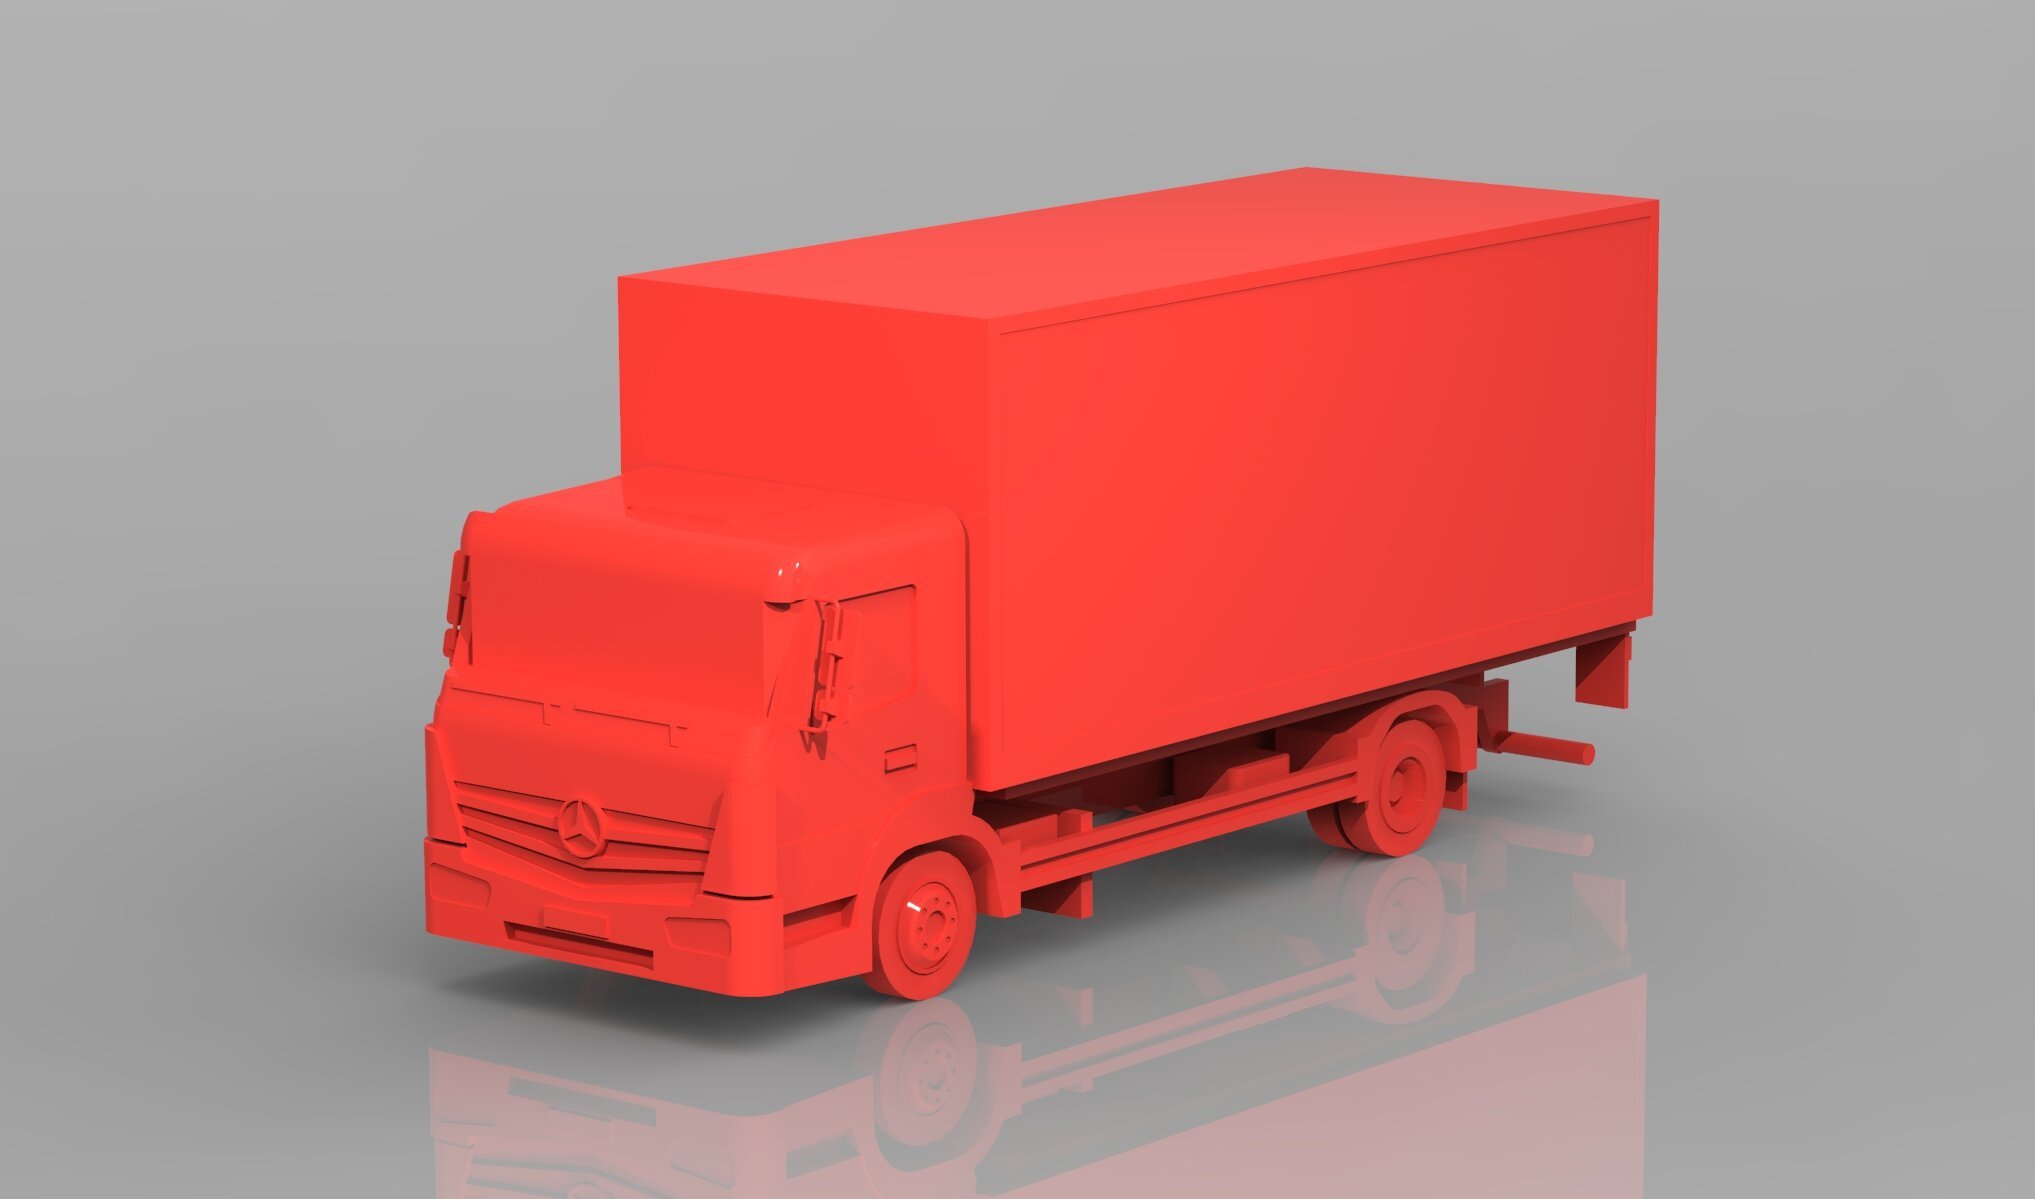

The red model on the left shows the unmodified cargo truck
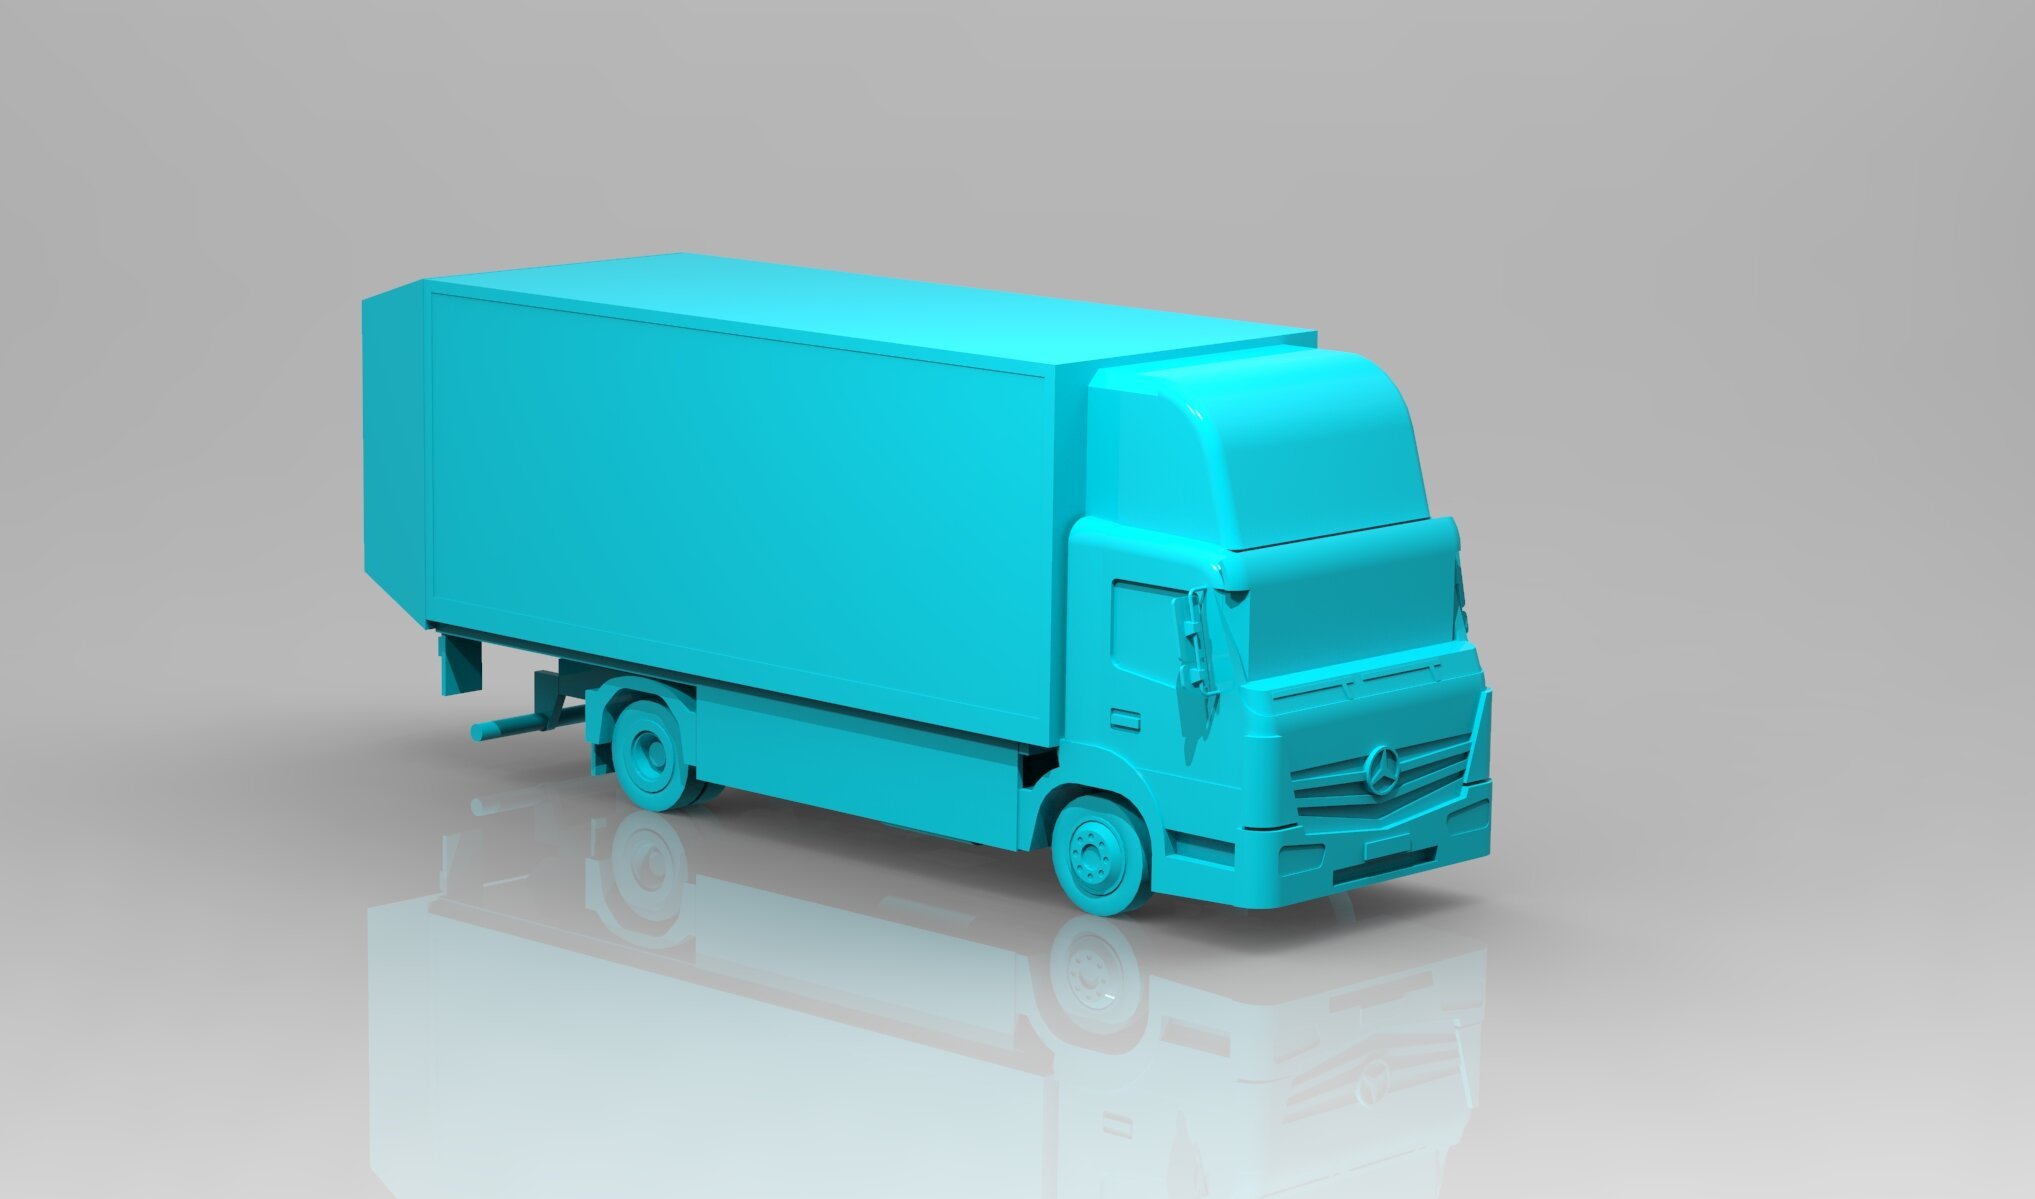

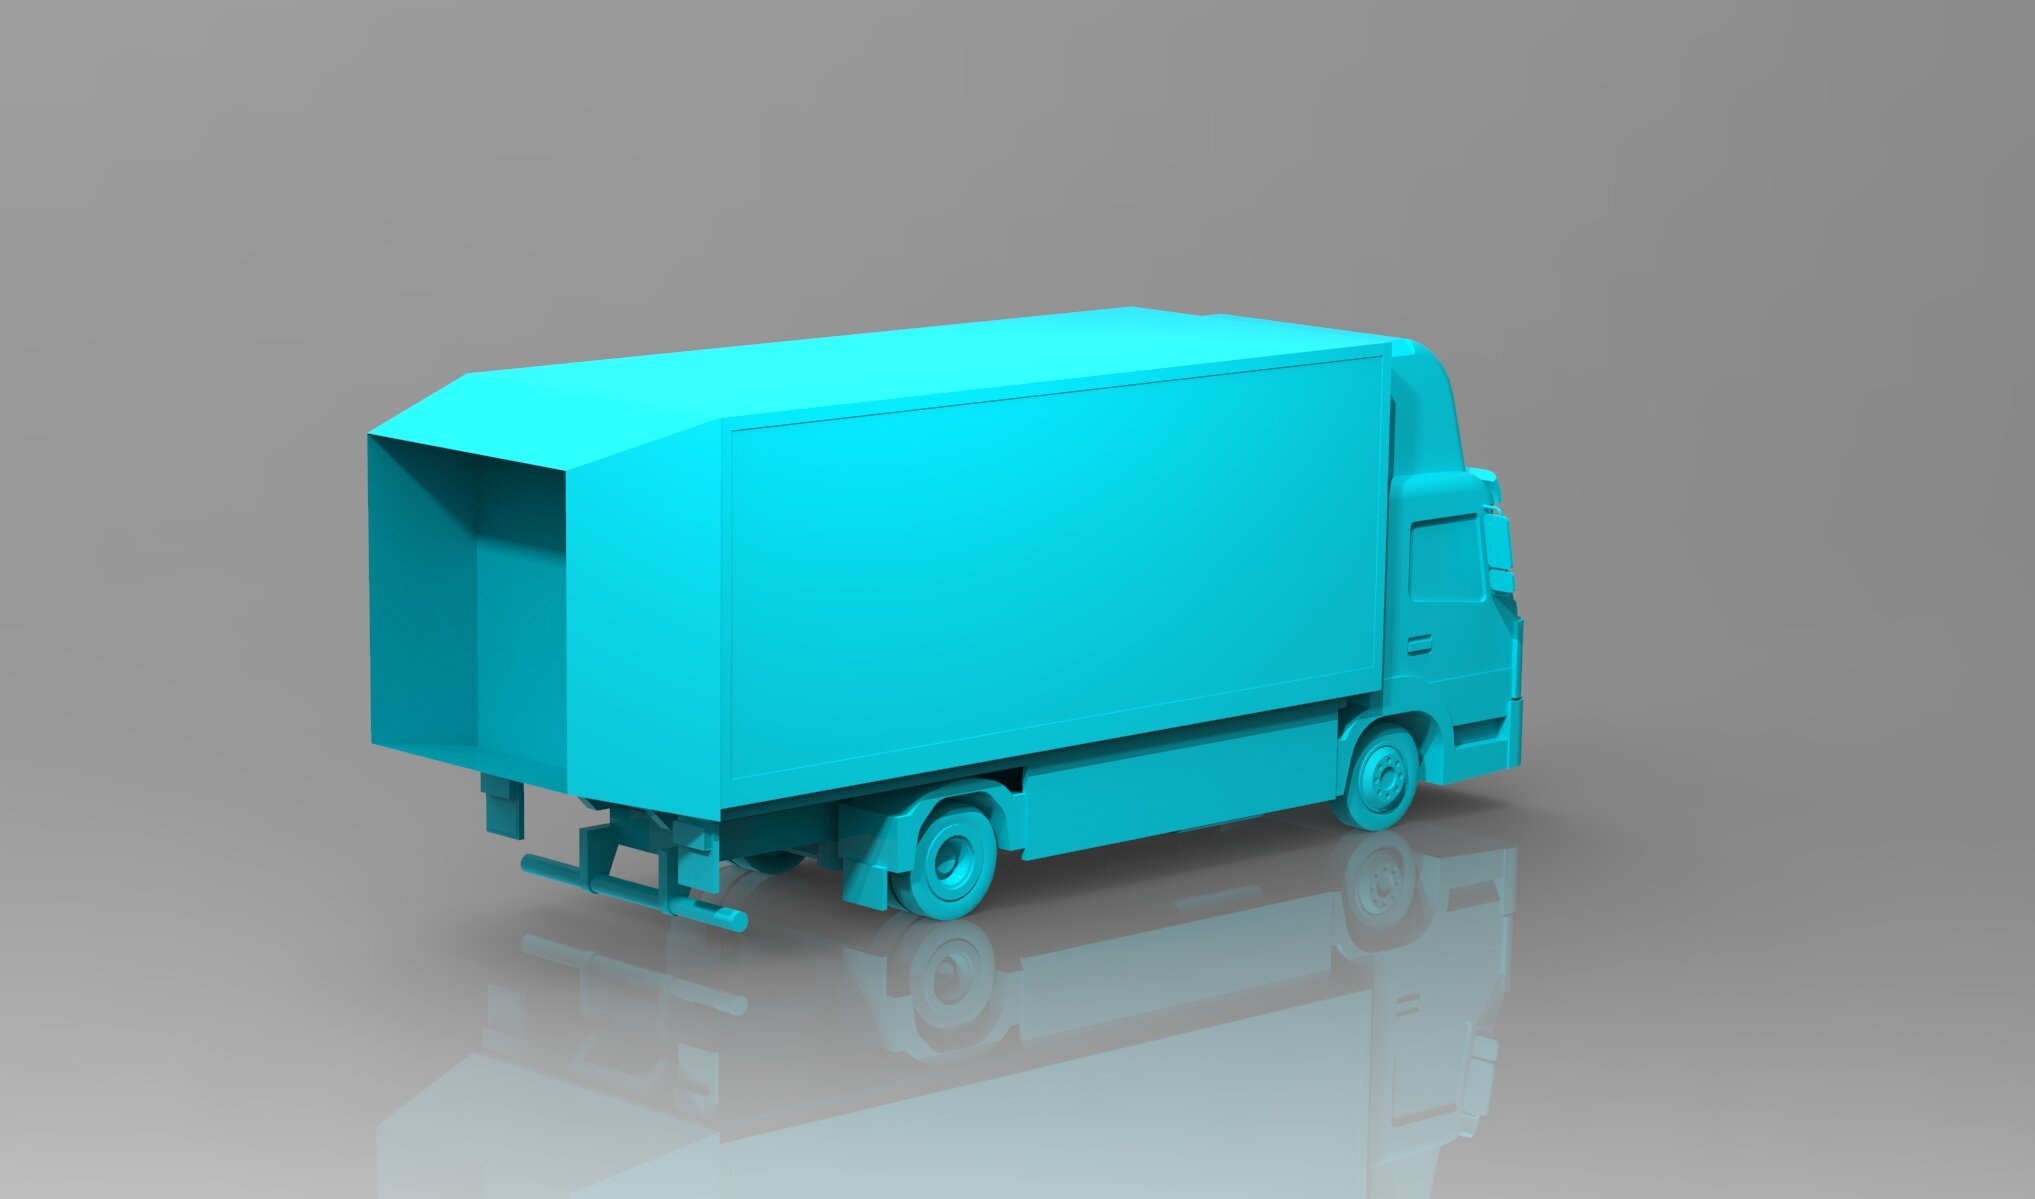
The blue model on the right shows the modified design with rear/front fairing and side skirts aerodynamic devices
Setup
The simulation was setup in Creo Parametric by using an assembly in order to isolate each component and it’s specific impact on the overall drag and efficiency calculations. The domain was setup with the ground at the height of the truck tires and the front as the air inlet. The top, sides, and back were setup as atmospheric pressure.

Results
The video below shows some very interesting characteristics of the flow dynamics around the vehicle both before and after the aerodynamic components are installed. The most obvious one is the amount of turbulence and low energy flow behind the unmodified design. This is clearly a very inefficient area and shows that there is lots of improvements that can be made overall. The modified design maintains its air velocity along the profile of the vehicle and exists in much more fast and efficient method.

Velocity Magnitude Simulation
The two plots show the color gradient corresponding to the velocity magnitude about the vehicle.

This velocity magnitude simulation shows the large pocket of low velocity flow trapped behind the rear of the cargo box

The addition of the aero devices show a greatly reduced low velocity pocket behind the vehicle in the same simulation
The two plots below shows the flow lines of air with the color corresponding to the velocity magnitude.
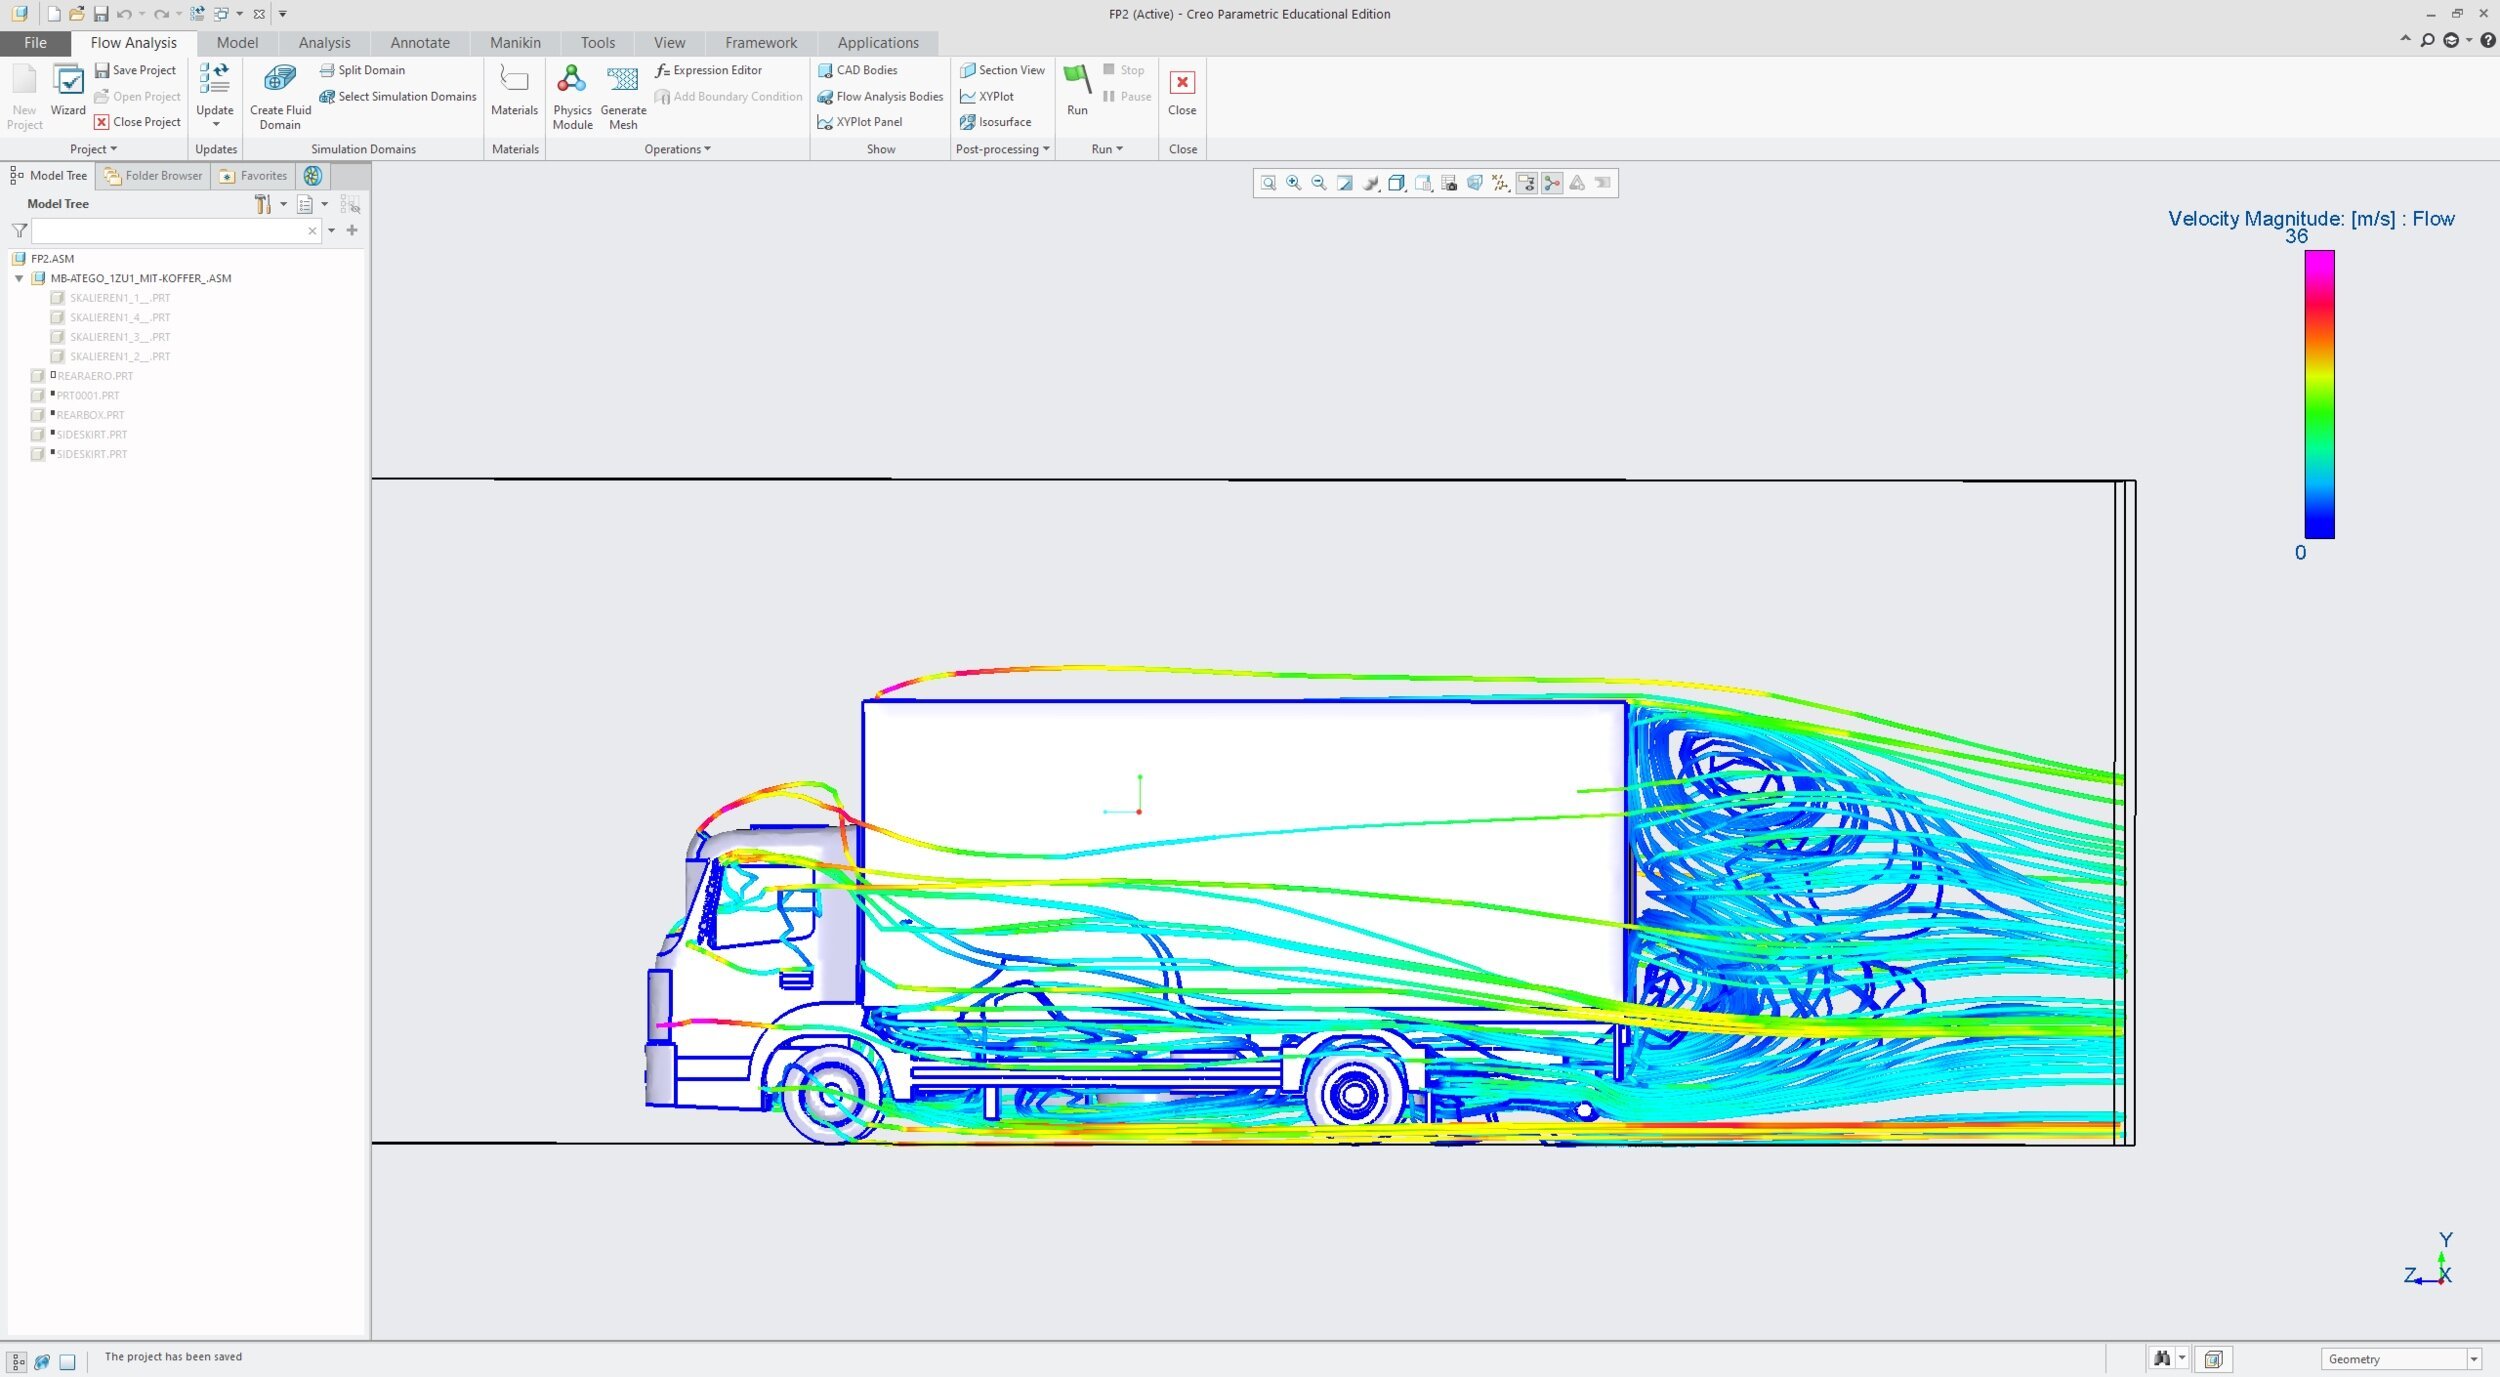
The unmodified model showing the low velocity flow getting trapped behind the vehicle

The modified model showing the higher velocity and streamline flow across and behind the vehicle
Drag Calculations
Finally the simulation allowed a direct comparison for the overall drag forces and showed a remarkable 22% reduction in drag using the additional aerodynamic devices.

Conclusion
At highway speeds any reduction in aerodynamic drag correlates to half that reduction in fuel efficiency. The calculated benefit of 22% drag reductions there would be an 11% benefit in fuel efficiency from these components.
When considering the average distance driven by a long haul tractor trailer of around 100,000 miles per year with an average mpg of 5.9, these parts would save over 1,500 gallons of fuel over that year. Given a national average price per gallon of 3$ this would save over 4500$ per truck over one year alone.
Additionally CO2 production would be reduced by a similar percentage, going from an average of 1700g per mile to 1513g, which corresponds to a overall saving of 20 tons of CO2 over the year. Clearly the benefits of these components exist both financially and environmentally, especially when we consider the two billion trucks on American roads alone.